Surface Engineering by Expanded Austenite
Roughness Surface Testing (RST) Analysis


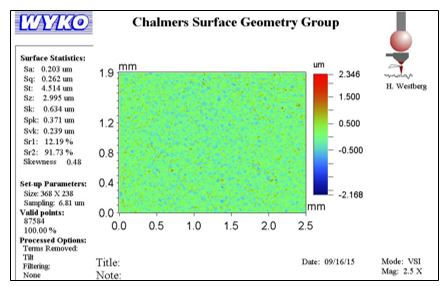
Each sample was first analysed under the 2.5x magnification optical microscope (Figure 26). This magnification level was used to gauge the average surface roughness of the polished sample faces. Some pixels may have missing data; however the algorithm can predict the height of that spot from the surrounding area. Once the 2.5x optical measurement had been completed the magnification was increased to 40x. At this magnification information on the grain behaviour can be extracted, including variations in height.
The surface roughness of each sample is taken from the “sa” statistic. In the case of Stainless Steel 2343, the average surface roughness of the area in question is 0.220 µm.
Grain Size Estimations
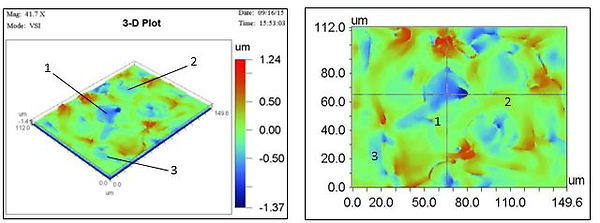
The grains within the 2343 sample are very clear as the grain boundaries show clear ridges. This allows for easier analysis of the average grain size, which was found to be 1255 µm2 for the carburised 2343 sample.
The grain sizes were calculated by the interactive 2D image (Figure 28); this would bring up cross hairs on the image. The figure above is an example of the two graphs that were then produced showing how the surface height varies along the y-cross hair and similarly for the x-cross hair. The approximate grain size could then be calculated by finding the peaks that represented the grain boundaries and an average sizing of the three grains were taken.
At this stage the average grain estimations carried out using the RST results were only to be used a validation of the more accurate optical microscopy grain sizing analysis which was carried out using optical microscopy analysis.
Average Surface Roughness & Grain Sizing Measurements
It was assumed that prior to the carburisation treatment, the roughness of the polished faces of each sample were equally negligible.
It is clear from the table above that the two nickel samples (Inconel 617 and Nikrothal) have considerably smoother surfaces than the majority of the stainless steel alloys after the expansion of austenite. This is because it is much more difficult to carburise nickel alloys. Due to the fact that each sample was treated at the same temperature for the same amount of time (except the K33 samples), the nickel samples were saturated with less carbon and therefore the austenite did not expand to the same extent as in the case of the stainless steel micro-structures.
The K33 samples were treated for a longer period of time, therefore more carbon should have theoretically been absorbed and consequently created a rougher surface than the K22 samples. This is seen to be the case in Nikrothal where the K33 sample is slightly rougher than the K22 sample. However the Inconel 617 does not follow expectations, with the K22 sample being slightly rougher than the K33 sample. This backs up the XRD findings where Inconel 617 K22 expanded more than the K33 counterpart.
The poor expansion of the SS 353 sample, shown in Table 11 could also be contributed to the high nickel content within the sample. It was noted in the XRD analysis that of all the Stainless Steels, SS 353 appeared have expanded the least, therefore this low roughness value was to be expected.
From the surface roughness results the stainless steel alloys SS 2343 and SS 832 appear to have absorbed the most carbon. However the XRD results do not appear to match with these rankings. This suggests that the lattice expansion shown in the XRD evaluation does not directly relate to the surface roughness of the treated samples. As the roughness is related to both the lattice expansion and the depth of the carburised layer, a further analysis of the roughness will be carried out.
It was thought that there could have been an inverse relationship between the Molybdenum content of the samples and the surface roughness. The reason for this being; the relatively large atomic number of Molybdenum creating consequently larger interstitial trapping sites for carbon atoms to diffuse in. This extra space would cause a smaller expansion of the lattice and subsequently have a lower decrease in surface roughness. However with sample SS 254 having the highest Mo content of the stainless steels, no this relationship was unclear as other elements present could be playing a role in the expansion.
Ranking of Average Surface Roughness’s
RST Summary
The RST investigation clearly showed that both of the nickel based samples were not able to absorb as much carbon as the iron based samples, regardless of which carburisation treatment was used, with the surfaces showing no significant roughness increase. Of the iron samples, SS 353 had considerably the smoothest surface. In contrast the samples which have the roughest surface were SS 2343 and SS 832. These results did not perfectly correlate with the XRD lattice expansion results.


