Surface Engineering by Expanded Austenite
Optical Microscopy Analysis

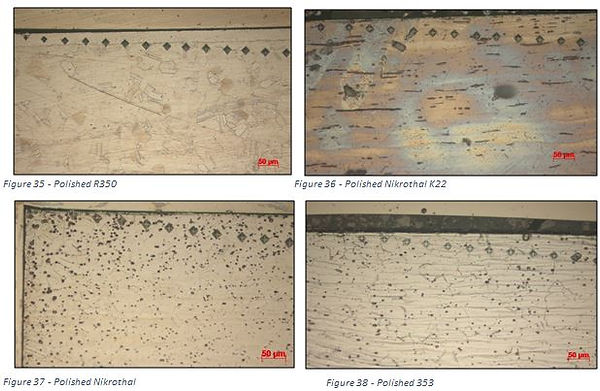
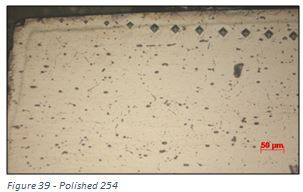
There was quite a difference between each samples reaction to the etching process, with the carburised layer corroding faster than the substrate which is a surprising result. Also it is clear that the interface between the nickel coating and the material in question was the fastest part to corrode in all samples, but with varying intensity. This may have affected the expanded austenite layer depth measurement.
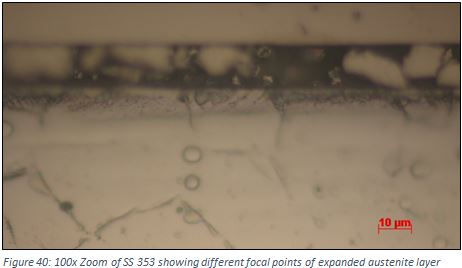
This faster corrosion effect can clearly be seen in sample 254 (Figure 39) and sample 353 (Figure 38) where the first micro-indentation is being overlapped by a dark layer. This dark layer is a particularly noticeable feature in SS 353 where about half the expanded austenite layer is consumed. This dark layer witnessed could potentially be enriched with carbides. Although not visible in the XRD results due to the asymmetrical {200] peak, it does act to confirm the suspicions that carbides were potentially present within the sample after carburisation.
The focal point between the grey layer, the rest of the expanded austenite layer and the substrate material which is enhanced in Figure 40 was different, therefore making the measurement of the depth of the expanded austenite layer very difficult. This also backs up the theory that the black layer is of different composition and contains carbides. To confirm whether the depth value taken from the optical microscope is correct and whether there are carbides at the surface, sample 353 is planned to be subject to Scanning Electron Microscope (SEM) and Electron Deposition X-Ray (EDX) analysis.
Carburised Layer Depths
Analysis of the carburised layer depths were taken starting from both the polished and non-polished faces of the samples. The resultant depths are displayed in Table 13.
Nickel Samples Analysis
As has been shown in the previous analyses the nickel based samples have not been receptive to either carburisation treatment, with the thickness of the carburised layer of both nickel samples being thinner than the depth of any iron based samples. Again the Nikrothal sample was the worst performing of the two nickel samples, showing a maximum depth of only 5.2 µm. A visual representation of the difference in the depth of the expanded austenite layer between an iron and nickel based sample is shown belowin Figures 35 & 33. The difference in the way in which the Nikrothal samples reacted to the K22 and K33 treatment is negligible. However when examining the Inconel 617 material, a thicker layer was found within the sample that had been subject to the K33 treatment. Although this was to be expected as this was the treatment involving the lengthier process, it is contradictory to the results of all of the previous investigations which showed the K22 treatment to be slightly more effective.
However the depth of the carburised layer can also be defined qualitatively by the following ‘effective surface roughness’ formula (below) relating layer depth, surface roughness and lattice expansion;
When using this equation, the qualitative depth of the carburised layer of the K22 treated Inconel 617 sample was greater than the K33 sample, in accordance with the previous investigations.
Iron Sample Analysis
The iron based samples with the thickest layer of expanded austenite were the SS 832, SS 2343 and SS 254 samples, with expanded layers of between 38 µm and 30 µm thick. These are also the three samples which had the highest RST roughness values which were expected, as it is understandable that a deeper layer of diffused carbon atoms would cause greater lattice distortion. Furthermore, the two iron based samples with the lowest RST roughness (SS R350 and SS353) also have the shallowest carburised layer.
It is noted that the ranking of the layer depths of the iron samples does not exactly correspond to the RST surface roughness rankings. This could be partly explained by the Molybdenum (Mo) content. The SS 254 sample appears to be the hardest sample and also showed the greatest lattice expansion. But it was only the 3rd roughest surface and had the 3rd thickest carburised layer. Of all the iron samples, SS 254 had the highest Molybdenum content of approximately 6%.
As previously explained in the ‘Surface Roughness Analysis’ section, a higher Mo content causes the atoms within the microstructure to be more loosely packed due to the larger atomic sizing of Mo atoms, a lower atomic packing factor (APF). This increase in interstitial spacings allows for a greater amount of carbon atoms to fill these spaces without a large corresponding lattice expansion. Therefore it stands that it is possible for the material which is the hardest is likely to not be the material which has expanded the largest amount or has the deepest carburised layer.
Polished Vs Unpolished Cross Section Analysis
When comparing the depth of the expanded austenite layers found on the polished and unpolished faces of the iron based samples, a thicker layer (by approximately 1 µm) was found on the unpolished side of all samples with the exception of SS 353.
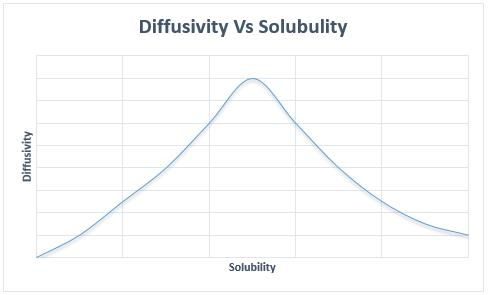
The depth of the carburised layer is mainly affected by the solubility and diffusivity of carbon in the material. The solubility of a materialcarbon is controlled by three factors:
-
Ability of atoms to move through the grain boundaries
-
Ability of atoms to move though the bulk material
-
Ability of atoms to move through dislocation
The diffusivity of a material is a direct consequence of its solubility. The diffusivity of a material tends to increase with solubility, but only until a saturation limit, where the sheer amount of solute atoms (in this case carbon), inhibit the ability of atoms to move through the crystal lattice.
It is known that the solubility of a non-polished, rougher face is greater due to the increase in the number of dislocations due to the lack of surface finishing treatment, which explains the ability for the non-polished surfaces to form a thicker modified layer.
This shallower layer on the polished side could perhapscan be explained by deformation induced martensitic transformation caused by the sample preparation (polishing). This occurrence of martensite is bad for the formation of expanded austenite.
“The martensite is stronger and harder than the austenitic structure, causing a composite strengthening and thus a high strain hardening effect” [61]
However this was not visible throughout any of the investigations.
This could also possibly beis partially the reasoning for the polished face surface being harder than the non-polished surface. It is also an explanation for the expansion of austenite being greater on the non-polished face.
TThe reason for the SS 353 having a thicker modified S-Phase layer on the polished face compared to the other stainless steels which had a thicker hardened layer on the unpolished side, is probably related to the thicker dark layer witnesses on the unpolished side than the polished side, suspected to be carbide precipitates. This means that more carbon was consumed for carbides than were allowed to diffuse through the solid solution; therefore the polished side’s S-phase layer would be thicker.fact that although it showed little lattice expansion, it is one of the hardest samples. It could also be due to the fact of all the stainless steels, SS 353 has the highest nickel content.
When looking at the Inconel 617 samples, when subject to both carburisation treatments, the deepest layer was found on the polished side. However it was not possible to give a full explanation of the reasoning for this within the context of this report.
Average Grain Size Determination
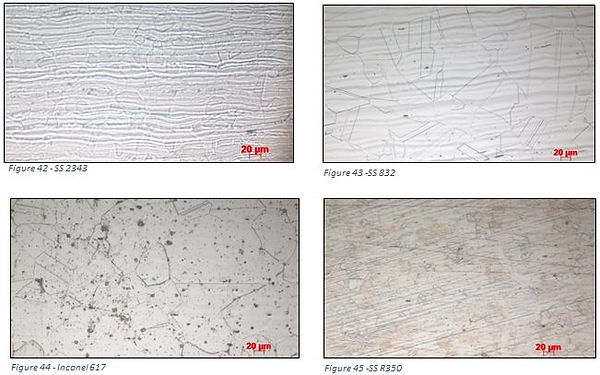
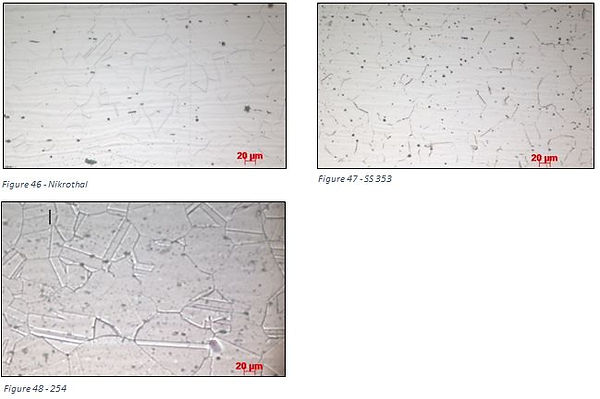
A more accurate method of determining the average grain size within the samples is to measure them under an optical microscope rather than with the RST equipment. This analysis was carried out on the cross section of the samples. As acquiring precise grain sizesings was not of great benefit to the investigations, visual inspections were carried out to confirm that the grain sizingssizes were within an expected range and correlated to the sizingssize found in the RST measurement.
According to RST testing, approximate average grain lengths should fall within the region of 30 µm to 45 µm. Visual analysis of the samples via optical microscopy appeared to confirm this.
The horizontal ‘wave-like’ lines that are particularly prominent in samples SS 2343 and SS 832 are a result of the electrochemical etching process.
One detail which was evident was the slightly larger grain sizeings of the two nickel samples. This could partly be an explanation for the exceptionally thinner carburised layer witnessed in the nickel samples. This is because larger grain sizes result in a lesser total perimeter of grain boundaries and an increase in bulk material.
As described above, the grain boundaries and bulk materialsgrains themselves are both paths which solute (carbon) atoms take when diffusing through a material. However diffusion along grain boundaries is subject to less obstruction than diffusion via bulk materialgrains. Therefore the larger grains and henceforth lesser total grain boundaries result in a material being less soluble and so less susceptible to carbon diffusion.
Optical Microscopy Summary
By visual inspection it was shown that Stainless Steel 353 showed an unusual dark layer at the boundary of the expanded austenite, which was thought could be due to decreased corrosion resistance originated from the formation of carbides.
In terms of the depths of the carburised layer, the most obvious conclusion to be drawn was that a thicker layer was able to be formed on the non-polished side of all the iron based samples, except for the SS 353 sample.
Once again it was proved that nickel samples were not at all reciprocal to either carburisation treatment, with a maximum layer of thickness of 5.2µm being found. The Inconel 617 samples had a marginally thicker layer than the Nikrothal samples. Qualitative examination using the effective surface roughness formula showed the K22 treatment to be more effective in all cases.
The layer depth of the iron based samples appeared to closely resemble the RST surface roughness results.
